If we have loaded a crystalline specimen into the electron microscope and we press the diffraction button, then what we see is grid of bright spots. People often say this grid (which is usually incomplete only a few bright spots are lit up, unless the specimen has been accurately aligned) is like a diffraction grating pattern. It is like a diffraction grating pattern, although in fact, unlike the pattern we would obtain from an optical diffraction grating, the behaviour of an electron diffraction pattern is made more complicated by the thickness of the object and multiple (dynamical) scattering.
I still think it is worth rehearsing the behaviour of a conventional (optical) diffraction grating before we try to discuss three-dimensional electron diffraction effects. There three reasons for this: 1) diffraction from periodic (crystalline) arrays of atoms is absolutely key in electron imaging, and so we may as well spend some time understanding fully the simplest example of diffraction from a one-dimensional periodic object; 2) the diffraction grating can give us a qualitative insight into the nature of the convolution theorem; 3) the diffraction grating can illuminate, in a physical way, the difference between the Fourier integral and the discrete Fourier transform.
in order to find the amplitude of the Fraunhofer diffraction pattern. Now lets think about taking the Fourier transform (that is, forming the Fraunhofer diffraction pattern) of not a continuous top-hat function, but one made up of a series of spikes, like a hair comb. Physically, we would construct this from a series of equally-spaced slits a diffraction grating. The functional form of the exit wave emerging immediately behind the grating looks like this:
To begin with, lets assume each spike in this function is infinitesimally narrow. We can use our mechanical Fourier transform machine to calculate what the diffracted amplitude will look like a very long way from the grating, as a function of angle. I want to think about this by considering more and more slits, starting off with just two slits. In other words, a series of functions that looks like this:
In the complex plane, we will have wave value vectors for these four examples that, at some small scattering angle, add like this:
At we increase the scattering angle, the vectors rotate, changing the resultant vector, which, as before, we draw between the two ends of chain of wave vectors. Of course, in the limit of infinitely many tiny slits, we tend towards the chain being a continuous line, like in our calculation of the sinc function. At the opposite limit of just two slits, we just have our Youngs slits amplitude distribution. It doesnt take much imagination to think through what will happen to the resultant vectors, as a function of scattering angle, between these two extremes. Qualitatively, for an increasing number of slits, the diffracted amplitude looks like this:
These diagrams are not quantitatively accurate (I did them using the mouse and the curve autoshape, so they are a bit wonky the crossing points and magnitudes are purely qualitative). Whats happening is that as we increase the number of slits, then the snake of added component vectors writhes around in a tighter and tighter bundle. Every so often, the bundle straightens out into a large magnitude. For two slits, the first maximum magnitude occurs on the first vertical line (above), and is purely negative. For three slits, it occurs on the second line, and is positive. For four slits, the first maximum magnitude occurs on the third line, and is negative, and so on and so forth.
Aside: We might infer from these diagrams that the complex value of a diffraction pattern from an array of atoms changes very dramatically depending on whether we have an even or an odd number of atoms across the width of a crystallite. Well, that's not quite true. The way we've constructed our distribution of slits (atoms) here means that an even number of slits appear shifted (by half their spacing) along the x-axis relative to the case of an odd number of slits. This shift is really responsible for the positive and negative peaks in the amplitude, because a shift introduces a phase ramp across the Fourier transform. Because here we have arranged to keep the result purely real (by keeping the slits symmetric about the origin), then this phase change results in a π shift in some of the even-slit diffraction peaks. Don't worry about it... :end of aside
RELATED VIDEO

RELATED FACTS
-
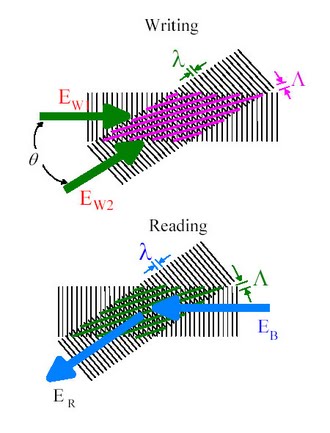 Electromagnetically induced grating (EIG) is an optical interference phenomenon where an interference pattern is used to build a dynamic spatial diffraction grating in matter. EIGs are dynamically created by light interference on optically resonant materials and...
- Due to the effect of a spatial context or temporal context, the perceived orientation of a test line or grating pattern can appear tilted away from its physical orientation. The tilt illusion (TI) is the phenomenon that the perceived orientation of a test line or...
- An apparatus and method for simultaneous chirp adjustment and frequency conversion of an ultra-short input optical pulse A.sub.1 characterized by a center angular frequency .omega..sub.1,0 in a non-linear optical material with a quasi-phasematching (QPM) grating...
Share this Post
latest post
-
 Grating Spectrometers June 26, 2026
 -
 How to Make Holograms for Fake ID? June 16, 2026
 -
 Holographic Packaging June 6, 2026
 -
 Holographic Pen May 27, 2026
 -
 Hologram image projector May 17, 2026
 -
 Hologram Jordan 13 May 7, 2026
 -
 New hologram April 27, 2026
 -
 Hologram real April 17, 2026